Today I’ll be walking you through the process how to of make a wooden laser-cut topo map. I made one of my hometown of Portland, ME as a 2015 Christmas present for my family, and wanted to share how I did it since it took quite a bit of figuring out. If you’re not sure what I’m talking about, go check out pictures of the final product! Otherwise, here is a breakdown of the design phase, which continues to the build phase in the next post.
The design process:
- Download the needed software.
- Find elevation and road data and download it.
- Load up the elevation data and extract contour lines.
- Export the contour lines as .svg files.
- Load and export the road data as well.
- Load your .svg files and clean them up.
- Separate out your vectors into elevation layers.
- Add any custom art you want.
- Triple check everything to make sure it’s right.
- Export to a laser cutter format and send it off.
Let’s get started!
1. Download the needed software
You are going to need to download two pieces of software:
- QGIS, to load elevation and road data (free).
- A vector graphics editor such as Adobe Illustrator (paid) or Inkscape (free).
The number and depth of incredibly niche communities on the internet never ceases to surprise me. For example: cartographers! Before this project I had never considered the existence of a rich culture of map-makers. Turns out the cartography community is huge, ranging from from a wikipedia-style map of the world, to people drawing crazy maps of imaginary places, to hugely complex pieces of free open-source software to create custom maps. This last one is QGIS, which we’re going to use to load the raw elevation/road data and extract contour lines. It has far more capability than I can hope to understand, but is pretty straightforward for our purpose.
I used Illustrator for this project since I had it already, so my instructions will be for that. But Inkscape should work just as well – we won’t be doing anything fancy that would be program-specific.
I was completely new to QGIS and mostly new to Illustrator at the onset of this project, so if there are ways to speed up this process that I missed, please let me know in the comments! And if you run into issues, I won’t be of any help – your best bet is to use google and the forums dedicated to the software. I’ll be a bit more detailed with the QGIS process since Illustrator/Inkscape are really well documented and you should be able to figure out unfamiliar steps much easier.
2. Find elevation and road data and download it
The US Federal Government provides nationwide geographical data for free through the US Geological Survey website. However, I found it fairly hard to navigate and had a lot easier time going through my State. Here is the link to the Maine Office of GIS (Geographical Information System) that we’ll be using. Every state should have a similar website, and internationally I expect most developed countries to also provide this sort of data.
We are looking for two things: a digital elevation model (DEM), and a shapefile of our area’s roads. You can find both on that page. Other things of note which we won’t be using are the National Hydrography Dataset (for lakes and rivers), Lake Depth Soundings, and Bathymetry (for ocean depth, which would be necessary if the DEM didn’t include the depths in the port of Portland).
3. Load up the elevation data and extract contour lines
Now that you have your elevation data, it’s time to load it up into QGIS. Open up QGIS Desktop, and click the ‘Add Raster Layer’ button (circled in red). Navigate to your DEM file and click ‘ok’ on the default coordinate reference selection window. Your window should now look something like this:

Zoom into your area of interest (in this case, the Portland peninsula). If you’re using a 4-year old laptop like me, this can be slow to zoom and pan around. Once you have your view, click ‘Raster’ > ‘Extraction’ > ‘Contour…’ on the top title bar. In the window that pops up, select a path for your output file and give it a name. This will create a folder with that name and put your output contour files into it.
Now set your interval between contour lines. The DEM I’m using is in units of meters, so I put in ’10’ to give 10-meter (roughly 30 ft) contour lines. The contour lines will be every 10 meters as measured from sea level, which is fine since we’re on the coast. But if you want to a specific elevation as ‘0’ (such as if you were basing the map around an inland lake at say 235m), you can enter ‘-off 235’ as an option in the command window to offset the contour reference elevation.
Give it some time to chug through and process the data, and voila! Out spit the contours.

Now, this is still a bit messy. There are a bunch of tiny contours that are going to be troublesome when cutting the wood. So let’s clean up this data by removing all the short contour lines.
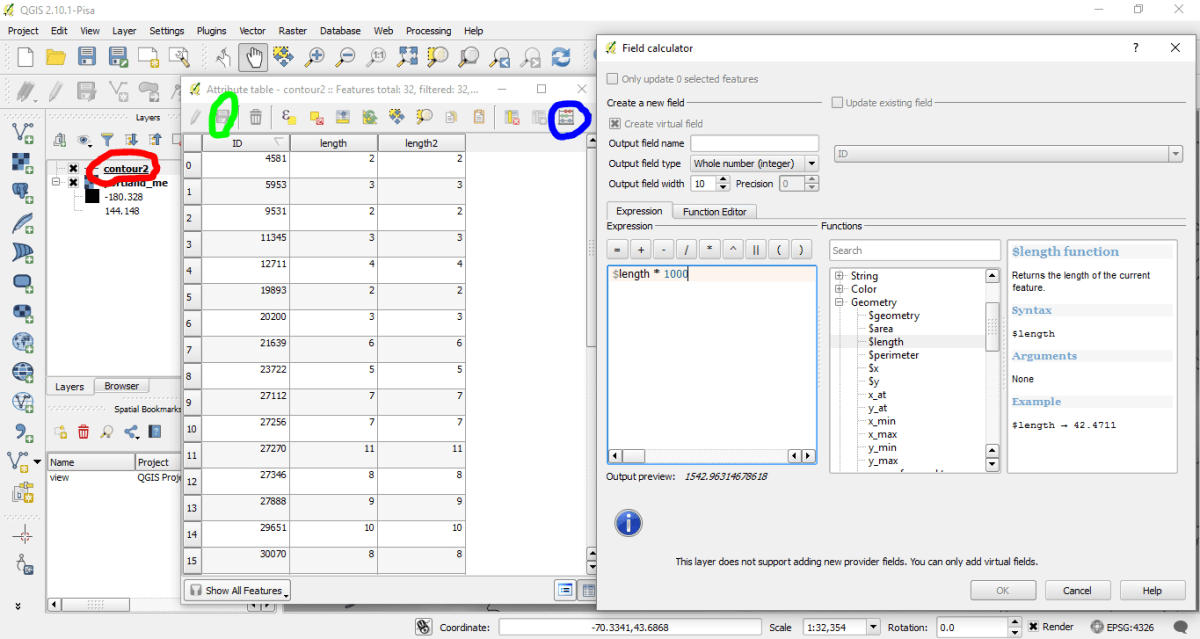
To do this, right-click on your contours layer (circled in red), and click ‘Open Attribute Table’. From there, click ‘Open Field Calculator’ (circled in blue). Type in ‘length’ into the output field name, and ‘$length*1000’ into the expression text box. Our distances are in units of km, so ‘$length*1000’ will give us length in meters (I think – I’m actually not 100% sure what unit this length is measuring). Click ‘ok’ to have QGIS calculate the length of all the lines, and then ‘Save Edits’ to apply the change (circled in green). Close out the window, right-click on your contours layer, click ‘Toggle Editing’, and save the changes.
Now, to get rid of all the short contours, right-click on the contours layer and click ‘Filter…’. Type in ‘”length” > 10’ into the box to include only contour lines longer than 10m and hit ‘ok’. Play with this to get something you like.

4. Export the contour lines as .svg files
Now our data processing is done, and we can save this as something we can edit. Uncheck the box next to your DEM layer to hide the shaded elevation and leave just the contour lines. Click ‘New Print Composer’ (circled in red),and click through the pop up box. Click ‘Add new Map’ (circled in blue) and use the pointer to draw a box in the white print area. Click ‘Export to SVG’ (circled in green) and save it. Finally, something we can use with a normal vector graphics editor!

5. Load and export the road data as well
The road data is much simpler, since it’s already in a vector format. Click ‘Add Vector Layer’ (circled in red) to load your road data, and follow the same steps as above to export it to svg.

6. Load your .svg files and clean them up
Ok, we’re done with QGIS now. Fire up Illustrator and make a new document. Your artboard should be the size of the wood sheets you’re using (in my case, 24″ x 12″). Load up the contour and road .svg files you just created and put them in as layers into this new file. Make sure their fill is set to ‘transparent’, and they have a thin stroke so you can see the details in the line (these options are circled in red). Now is a good time to make sure all these lines are in the right format for the laser cutter, because you’ll be making a lot of copies of these lines. The cutter I was using wanted blue lines for cuts, and red lines or black fills for etching.
Manually align and resize the contours and roads so they overlap correctly and are at the scale you want. Note that the lines are all grouped together – you may want to right-click and hit ‘Ungroup’ a few times if you’re editing individual lines. Things are coming together now!

If you want, you can skip to the next step at this point. However the contour lines are fairly jagged and I wanted them to be smooth in the final map. You can use the ‘Object’ > ‘Path’ > ‘Simplify…’ tool to do a first pass and clean it up with the ‘Smooth Tool’. I actually found it faster to roughly trace out the contours by hand on a new layer and do some minimal smoothing after that.
I didn’t want to make the man-made objects smoothed out, however,so I went back and straightened the bridges and the piers. I took a screenshot of google maps and threw it in a new bottom layer to help me out with figuring out where stuff should be. Google uses a different map projection so things won’t line up exactly, but it’ll be close enough to give you an idea.

7. Separate out your vectors into elevation layers
Ok, so the file now pretty much looks like how we’ll want it in the final map from a top-down view. But we’ll have to separate out the data into different layers so we can feed it to the laser cutter one layer at a time.
Create a bunch of new layers – as many as you have elevation levels. I had seven levels (spanning 70 meters – about 210 feet) but remember that you need an extra blank layer for the back face. Which makes eight layers total. With 1/8″ wood sheets, that will give the final map a total thickness of 1 inch.
Now ungroup the contour lines and move them to their respective layers.

You should also add some margin to the outer edge. To do this, create a new top layer that contains two bounding boxes: an outer one that is the same size as the artboard, and an inner one set about 1/2″ inside the outer one. Give the outer bounding box a white fill, and the inner one a transparent fill with a blue stroke (for cutting). Select both bounding boxes, and using the pathfinder window click ‘Minus Back’. This creates a white frame that covers up everything outside the inner bounding box, giving you that margin.
Now comes the complicated part: having each layer show only the roads you want to have engraved on that layer. Enlarge the image below and look at the layers window to follow along. On each layer, you’ll want to have two copies of the current contours (here, 90ft), one copy of the roads, one copy of the layer above (here, 120ft), and one copy of the combined bounding boxes. Stack them like so:
- Roads go on the bottom. Use one of the current contours (90ft) to clip out all the roads you don’t want by selecting both and selecting ‘Minus Back’ in the pathfinder window. You’ll have to ungroup the contour lines and turn them all into a single compound path before doing this. Same with the roads.
- The other copy of the current contours (90ft) goes next, with a blue stroke (for cutting) and transparent fill.
- Next comes the copy of the contours from the next layer above (120ft), with a white fill. You can put a red stroke (for etching) on this which will help with positioning during construction, but I recommend leaving it transparent since it will be visible if you glue the pieces of wood slightly off-target. See here for a picture of what I mean.
- On top comes the combined bounding boxes to clean up the edge.

Do this for each layer, hiding all the ones you’re not working on so you can clearly see what’s happening. All of this masking is so that we don’t cut or etch things we don’t need to, since time on the laser is $$$.
Important: all this masking won’t work for every laser cutter! I was lucky enough to find a company with a setup that accepted masking, and if you own a laser cutter then you’ll probably be able to figure it out. However, if you’re using a service like Ponoko.com, their laser cutters completely ignore masks. Their cutters see everything as in Illustrator’s ‘Outline View’, which you can toggle by pressing ‘ctrl-y’, and the result isn’t pretty:

If you’re using an outside company to do your laser cutting, ask them specifically if masking will work. If it doesn’t, then you’ll have to manually delete all the lines you don’t want cut or etched. I haven’t found an efficient way to do this, so if anyone knows how please leave a comment!
8. Add any custom art you want
Some ideas of fun stuff to add:
- A compass rose. I grabbed this one off of wikipedia and removed everything but the star. Stick an ‘N’ on top for cardinality.
- Labeling. I put a big ‘Portland, Maine’ on mine, but you could be more fine-scaled by labeling areas, bodies of water, major roads, etc. For all labeling, you’ll have to convert the text to outlines once your wording and formatting is finalized.
- A scale.
- Elevation markers.
- A message. I have one on the back for the family with a short message, my name, and the date.
- Your signature (scan, import, and live trace).
- Bridges. I was up in the air about whether to include them, so I cut them separately so I could add them in later. After finishing it I definitely recommend including bridges as part of the first land layer.
- Points of interest: Buildings? Shipwrecks? Mountain peaks?
- More data! I put in ferry routes. You could add footpaths, a repeating texture to show forests or land cover, political boundaries, dots for cities, etc.
Make sure these are on the right layers!
Something else that you might find useful is slotted holes on the back so that you can hang the map on the wall with nails. I was about to make one hole in the center, but realized that since the final map will have more wood on one side than the other, it would tilt to that side when hung on the wall. So I made two symmetrical holes far enough apart to support the uneven weight distribution.

9. Triple check everything to make sure it’s right
Some things to look out for:
- Overlapping contour lines.
- Roads that go into the water.
- Etches that should be cuts, and cuts that should be etches.
- Lines on the wrong layers (hide all the layers and cycle through them one at a time).
Errors are pretty easy to redo if you own a laser cutter, but if you’re sending it out to a company it’ll take a week to redo and ship out to you. It might be worthwhile to print out the layers on printer paper, cut them out with scissors, stack them, and see if everything looks good before sending the files off.

10. Export to a suitable laser cutter format and send it off
You’re done with the design phase! Go through every layer, hide the rest, and export it to whatever format the laser cutter can use. A .eps should work. Zip up all these files, send them off to a few companies for quotes, and come back to this site in a week when your package shows up. You may want to order the other supplies you’ll need at this time, which I’ll go over in the next post. Next step is the build phase.

You can click “expand” under the object menu and I believe it will apply the mask and cut out the extra crap.
Otherwise, the shape builder tool is wonderful for quickly clipping out unnecessary things.
This is awesome thank you for providing these instructions! I am having trouble generating contour lines for bathymetry data. Unfortunately I cant figure out how to set the datum at a negative value. Essentially the contour lines are generated from sea level and continue up at the specified interval. Could someone please help me offset the datum to a negative value or alternatively use a negative interval to extract contour lines. Much appreciated!
This is what shows up in my command window
gdal_contour -i 30.0 “C:/Users/patrick.helfrich/Desktop/good vector data/NOAA LAYERS/Georges Bank and ack shoals/noaa_13200_1.sid” “C:/Users/patrick.helfrich/Desktop/good vector data/Bathymetry/30”
I’m having the same problem. How do you get the below sea level contours?
You’ll have to find a file with seafloor depth data, and follow the same process. “Bathymetry” is the word to search for.
https://coast.noaa.gov/dataviewer Select elevation and it will open a map showing all the data that is available. Use the pencil to draw a box around the area you want. The menu on the right will show you what is available (if you don’t see the list on the right, just move your mouse to the right side of the map and it should pop up). Select the one you want, then follow the instructions on screen on how to download it. This is most comprehensive and easily searchable databases for bathymetry data.
Pingback: Make: Japan | 立体等高線地図の作り方
I wanted to try this for my local area here in Ireland but first I was gonna try the steps you have details and download the same data. I want to make sure I get the process right, what data I should get etc. When I go to the Main website and download the digital elevation model 2m from lindar I can only get a .lyr and .kml filetype which don’t seem to be readable in QGIS. Am i download the wrong file?
Hm, my general rule of thumb was that the right file was the really big one, and I’m guessing you’d use the .lyr. But I’m honestly not sure – you’ll have to search around the qgis documentation to see what file types work.
Hey Scott Do you know how to get rid of the above ground topographical lines? I am doing the SF bay area and would like to just show the topography under the ocean.
Yup, once you import all the lines into Illustrator, just delete the ones you don’t want.
Hi, Is it possible to separate the different heights in to different layers when exporting. When editing the data (in my case autocad) I have no idea anymore which layer is what height.
Not that I know of, but if you find out I’d love to hear how. I found it pretty easy to start at the bottom layer, color it a certain color, and then work outwards from there to identify which layers everything belonged on.
Hi Scott, this is super awesome and thank you for documenting it step by step! I’m trying to re create what you’ve done here but in QGIS I’m unable to do the Extraction > Contour… I’m not sure what is suppose to go into the “Input file (raster)” field and it wont let me continue after that step. I have a shape file but kinda lost on the next step.
Hm, is your shapefile loaded up and showing the grayscale elevation map? The raster shapefile is just what it’s looking for there, and if loads up then it should be a valid file and accepted as input. If that isn’t working it could be that your file isn’t actually a raster.
Scott, I am trying to figure out how much it might cost for me to do something similar to this. I don’t want to do all the work setting up the design to send to the laser cutting facility until I have at least a rough estimate of how much it would cost to get my project laser cut. Would you be able to share will me how much it cost you? Thanks
Hey Johnny, I was quoted $100/hr laser time for a rush job (got a bit of a discount after but most people would pay the base rate), and it took about 2.5 hours to cut. Price will obviously vary based on where you get it done and how soon you need it. Wood, frame, glue, paint, and stain was another $50-60. The most expensive part of this whole project of course is the time and effort that goes into it, but that should give you a sense of the dollars and cents.
Hi, I’m trying to do one of these for Chincoteague, VA, but haven’t been able to find a raster image for the surrounding waters. I tried the US Geological Survey, the Virgina office of GIS, and a bunch of other sites to no avail. I even tried to find the Atlantic Ocean, but no dice. Anybody got a line on where I could find this image?
https://coast.noaa.gov/dataviewer Select elevation and it will open a map showing all the data that is available. Use the pencil to draw a box around the area you want. The menu on the right will show you what is available (if you don’t see the list on the right, just move your mouse to the right side of the map and it should pop up). Select the one you want, then follow the instructions on screen on how to download it. This is most comprehensive and easily searchable databases for bathymetry data.
Hey Scott, this post is selfless, beautiful, and is the sole reason why I can now laser cut topographic maps. I love you.
Just to add another idea: you can use USGS Earth Explorer to get your black and white image (shown step3) which I believe is a DEM. I used USGS EE since I never ever figured out how to get DEM from the Maine or any other Office of GIS. What you do is select your map region( easiest to do by zooming in manually; selecting ‘Use Map’.)
Go to Data Set–> Digital Elevation–> SRTM(at the bottom of the expanded Digital Elevation tab, hard to spot)–> 1 Arc-second Global. Then do results. To export data you need to make a USGS account, its free and easy to do. And so far, I can only download DEM’s that are big, 1-arc-second sized maps and cut them down later. So using USGS EE isn’t perfect, but its a good alternative if you can’t find DEM’s elsewhere!
This takes the place of Step 2. Once you have your USGS Earth Explorer DEM, hop back into the tutorial in step 3.
This could be good for mapping places that dont have a geological survey? All the data is from the Shuttle Radar Topography mission that got sent up in 2000, and made available in 2015.It maps all land masses below the poles.
P.S. The toolbars and Panels that Scott used were not present on my ArcGIS program, so go to view–> Toolbars or view–> panels. You want the Layer Panel and I forgot the toolbar name, but its under View–> toolbars.
Can someone post the direct link to the sample data?
Dominik, you can download the data here: https://catalog.data.gov/dataset/portland-maine-coastal-digital-elevation-model
“Download NetCDF File” should give you the data you need.
I am also an engineer(civil) and am looking for someone to CAD carve a topographical map of Michigan, including both peninsulas, Isle Royal NP and Drumund Island. It would be on a 10/12 plyed plywood with overall dimensions of 36’x36′ or 48’x48″. Michigan’s lowest elevation is in extreme SE Michigan at Lake Eire and its highest is Mount Irwin in the Upper peninsula near Marquette. I want the map to illustrate its contours. Can you or would you make such a map? or know som people who would?
Please advise. Thank you.
Hey John, I think I can help you with this. Let me shoot you an email.
hi scott, really enjoyed the article, and I’m going through the motions of my own right now out of boredom from the pandemic. I had two questions I was hoping you could help with. First is about the data downloads. I’ve found a bunch of different topo dem’s for my area, but the bathymetry data is tougher. They vary greatly in resolution and the time they were collected. Is there a way to make sure I’m using the most accurate and recent data available, and how would I make sure that the information is using the same world projection/units (feet or meters) as my topo DEM? Secondly, I plan on making the cuts using a CNC machine instead of a laser, and I’m aware that I won’t be able to do the wood marking that you do for the roads and compass rose. If I use a fine enough bit and some paint fill do you think it would be possible to achieve the same level of detail? Or is there a workaround I could use?
Hi! This is amazing, I’m so excited to figure this out. I’m trying to make layered maps of lakes- just below water levels, no elevation above the water line. Do you know how I can just get that data? I’m getting lost on step two- tyring to find the data i need.
Thank you!
You need Bathymetric maps. You can get maps from NOAA – https://www.ngdc.noaa.gov/mgg/bathymetry/maps/nos_intro.html.